The District Pulse Check Report is your resource to easily view insights on engagement, performance, and feedback across your district or network.
If you are a district or network admin, log in to https://www.weeklypossip.com/login. From the Welcome Page, click on "District Pulse Check Reports" to be taken to your latest District Pulse Check Report.

Here's an overview of what you'll find in your Pulse Check report:
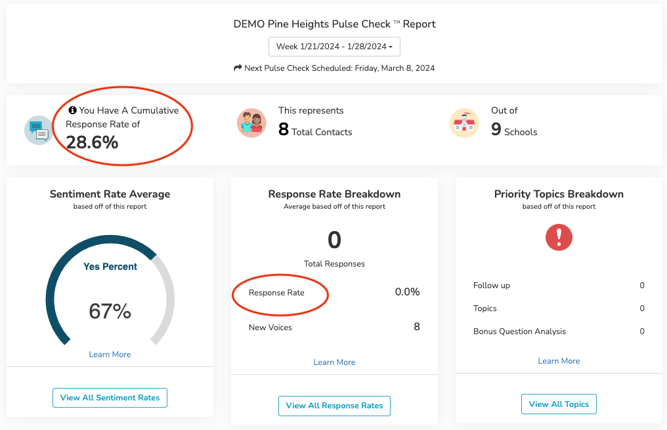
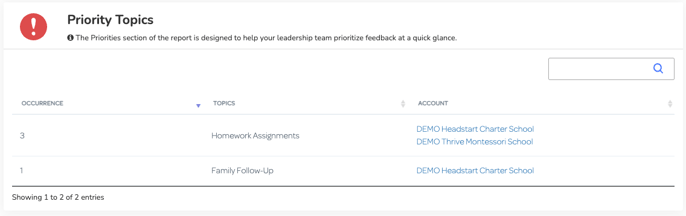
Priority Topics
Priority topics highlight the most frequently mentioned, trending topics for your community. Quickly identify overall needs and opportunities for development, and see direct comments in one place. It will help you lean into the most essential topics of specific feedback.
You can view priority topics by going to the Report's main screen and scrolling through the Priority section.
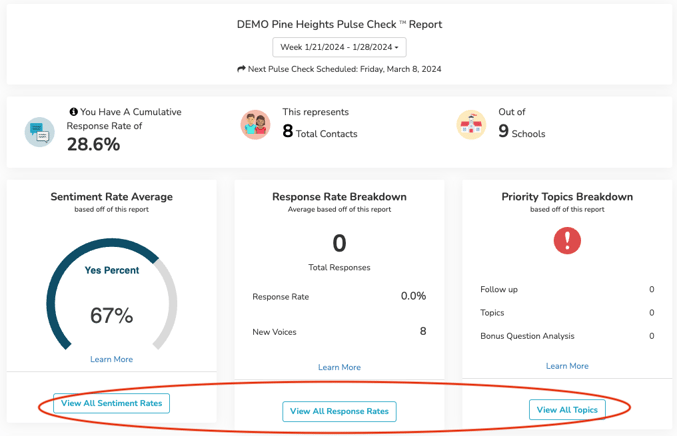
Digging Deeper into Results by School
Below each section you see the option to click and "View All" this will take you to a new view with more detailed information
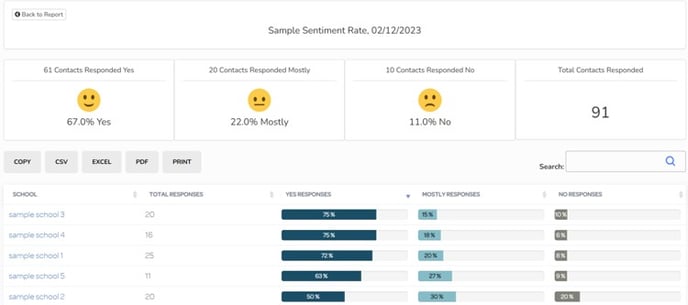
Sentiment Rates
Overall sentiment rates help you compare happiness at schools across your organization. This page allows you to easily visualize and sort the sentiment data by school as well as export it in different formats. You can:
- Identify commonalities amongst schools with the highest and lowest happiness
- Celebrate schools achieving high happiness
- Track happiness, which can be a leading indicator of student enrollment and staff retention
Learn more about the Sentiment Question here.
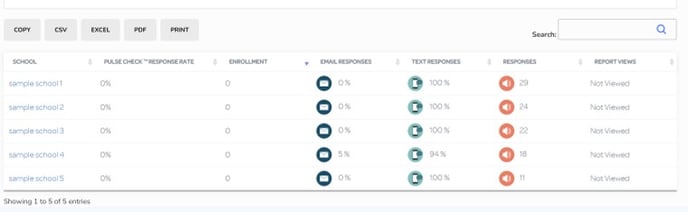
Response Rates
In this view you can see your Pulse Check Responses, the number of Text or Email Responses, and the Response Rate. You can sort by different metrics and export the data in a variety of file formats.
Response rates indicate the percentage of a contact list that has responded to each Pulse Check. Response Rates can indicate what schools could benefit from additional support or promotion in order to increase engagement. In order to learn why a response rate is low, you can dig deeper into a School's Dashboard to research if a high percentage of contacts are unreachable.
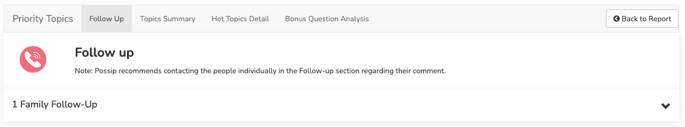
In the Priority Topics drill-down view you can easily see the total comments for Follow Ups, Trending Topics Summary, Hot Topics Detail, and Bonus Question Analysis. Clicking the drill down, on the far right-hand side, allows you to see the specific comments.
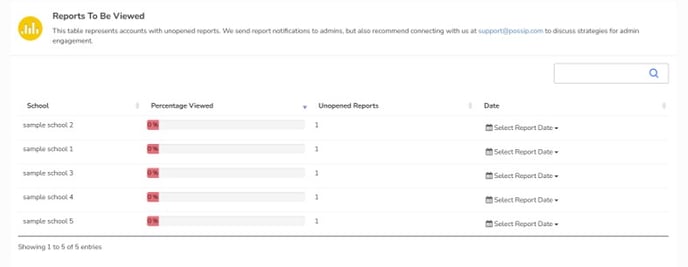
See if Possip Feedback Reports™ are being read by principals and school leaders. You will find Report Views by clicking on Sentiment Rates. Report Views may also impact Response Rates, which help indicate if schools are engaged with feedback or would benefit from 360 practices for follow-up.
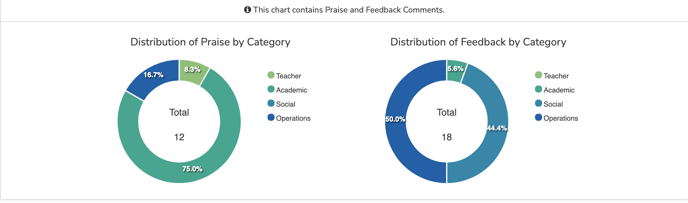
Distribution of Praise & Feedback
Quickly understand what category most comments fall into, and what types of praise and feedback your contacts share.
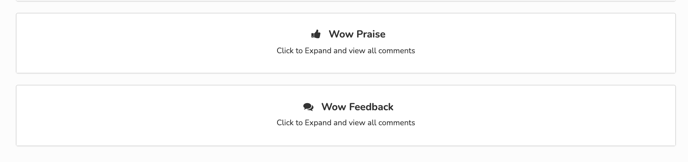
Wow Praise and Wow Feedback
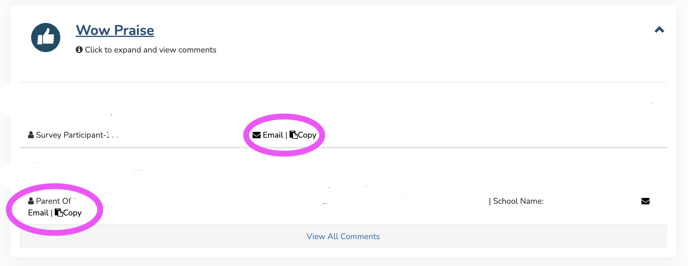
A quick snapshot of notable praise and feedback through direct comments from the Pulse Check.
Use the email and copy buttons anywhere they appear on district reports to easily share out a comment.
Contact support@possip.com to review your Pulse Check Report with Possip's Experience & Support Team.
Want to learn more or have ideas for other stats you would like to see? Possip learns what tools and resources are needed through your feedback! Share your ideas here.